An Easy Way to Draw Study Area
There are many ways to draw a map.
- ArcGIS, QGIS
WithArcGISandQGIS, firstly we need ashapefileof target area. - Adobe Illustrator
With theMapPublisherplug-in, people can draw high resolution maps. Also, it can be saved asPDF,JPEGorTIF. - R
If you don’t know anything about programming, you can also follow this tutorial. Mapping withRis pretty friendly. Users can export maps asPDForPNG.
Install R
Firstly, download and install R environment for your machine. Windows, Mac.
RStudio is a set of integrated tools designed to help you be more productive with R. download
Install ggmap
ggmap makes it easy to retrieve raster map tiles from popular online mapping services like Google Maps, OpenStreetMap, Stamen Maps.
1 | if(!requireNamespace("devtools")) install.packages("devtools") |
Here we use Stamen Maps and Google Maps as an example.
Examples
Use ggmap package.
1 | library(ggmap) |
Stamen Maps
With Stamen Maps, there are many themes to choose from. “Toner” is for high-contrast B+W (black and white) map, with six flavors: standard toner, hybrid, labels, lines, background, and lite. “Terrain” suits terrain maps, featuring hill shading and natural vegetation colors, with four flavors: standard terrain, labels, lines, and background. Moreover, there are “Watercolor”, “Burning Map” and so forth.
Draw a map of China:
1 | china <- c(left = 72, bottom = 15, right = 135, top = 60) # coordinates |
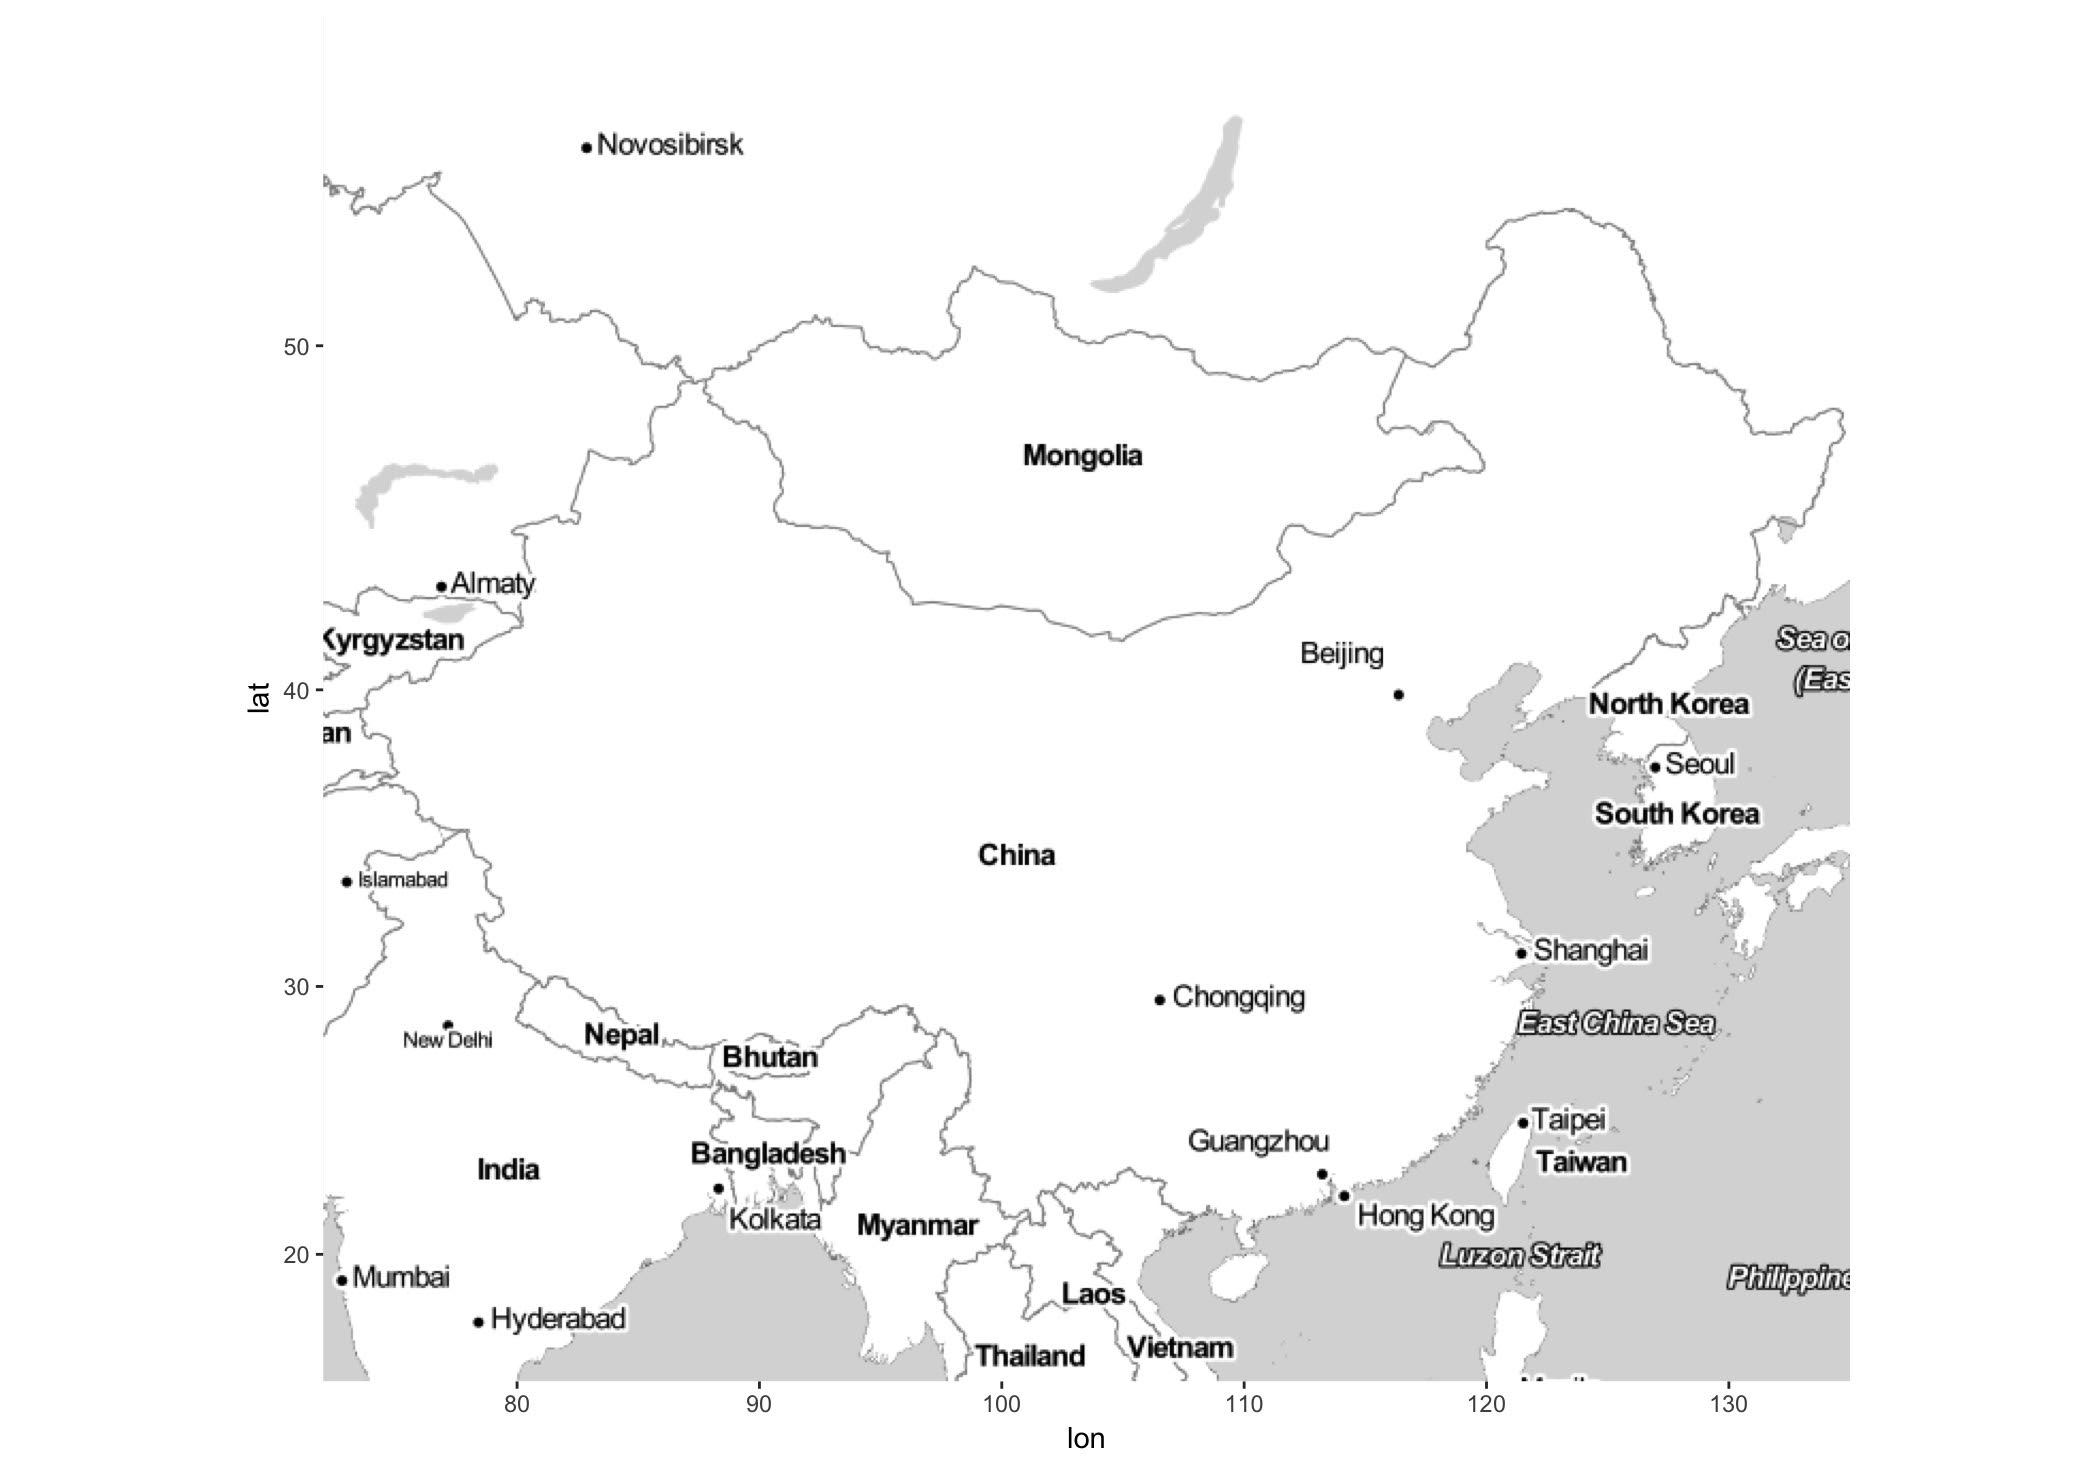
But the problem for Stamen Maps is not so detailed. If we set zoom = 12, the map is blurring.
1 | center <- c(left = 121.424063, bottom = 31.195848, right = 121.490231, top = 31.236447) |
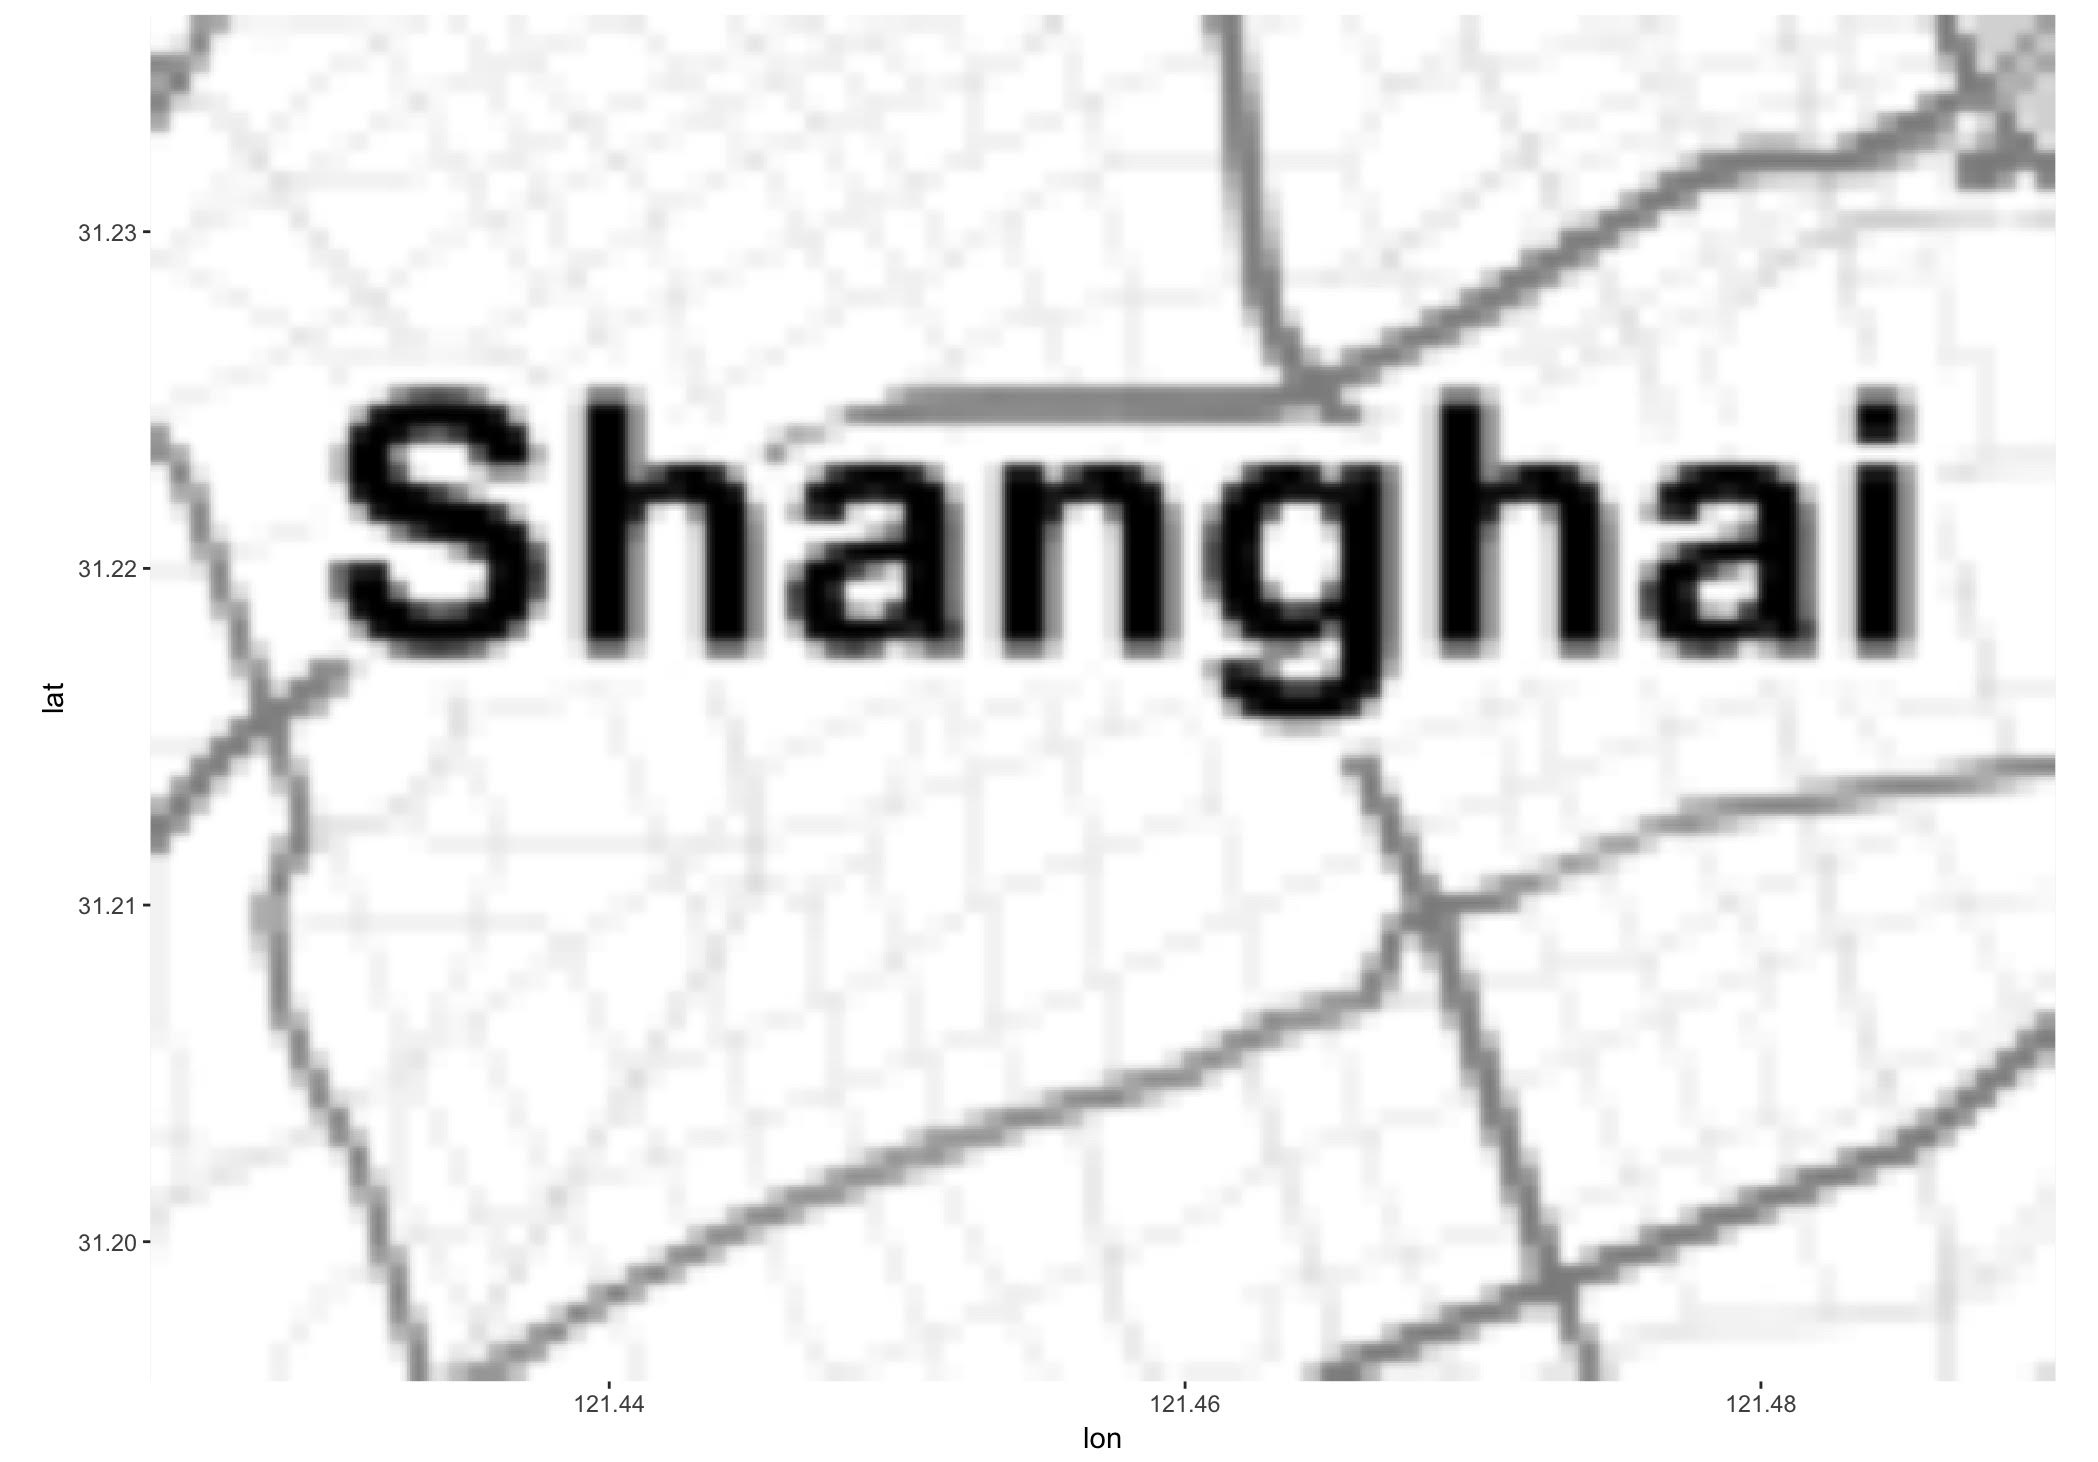
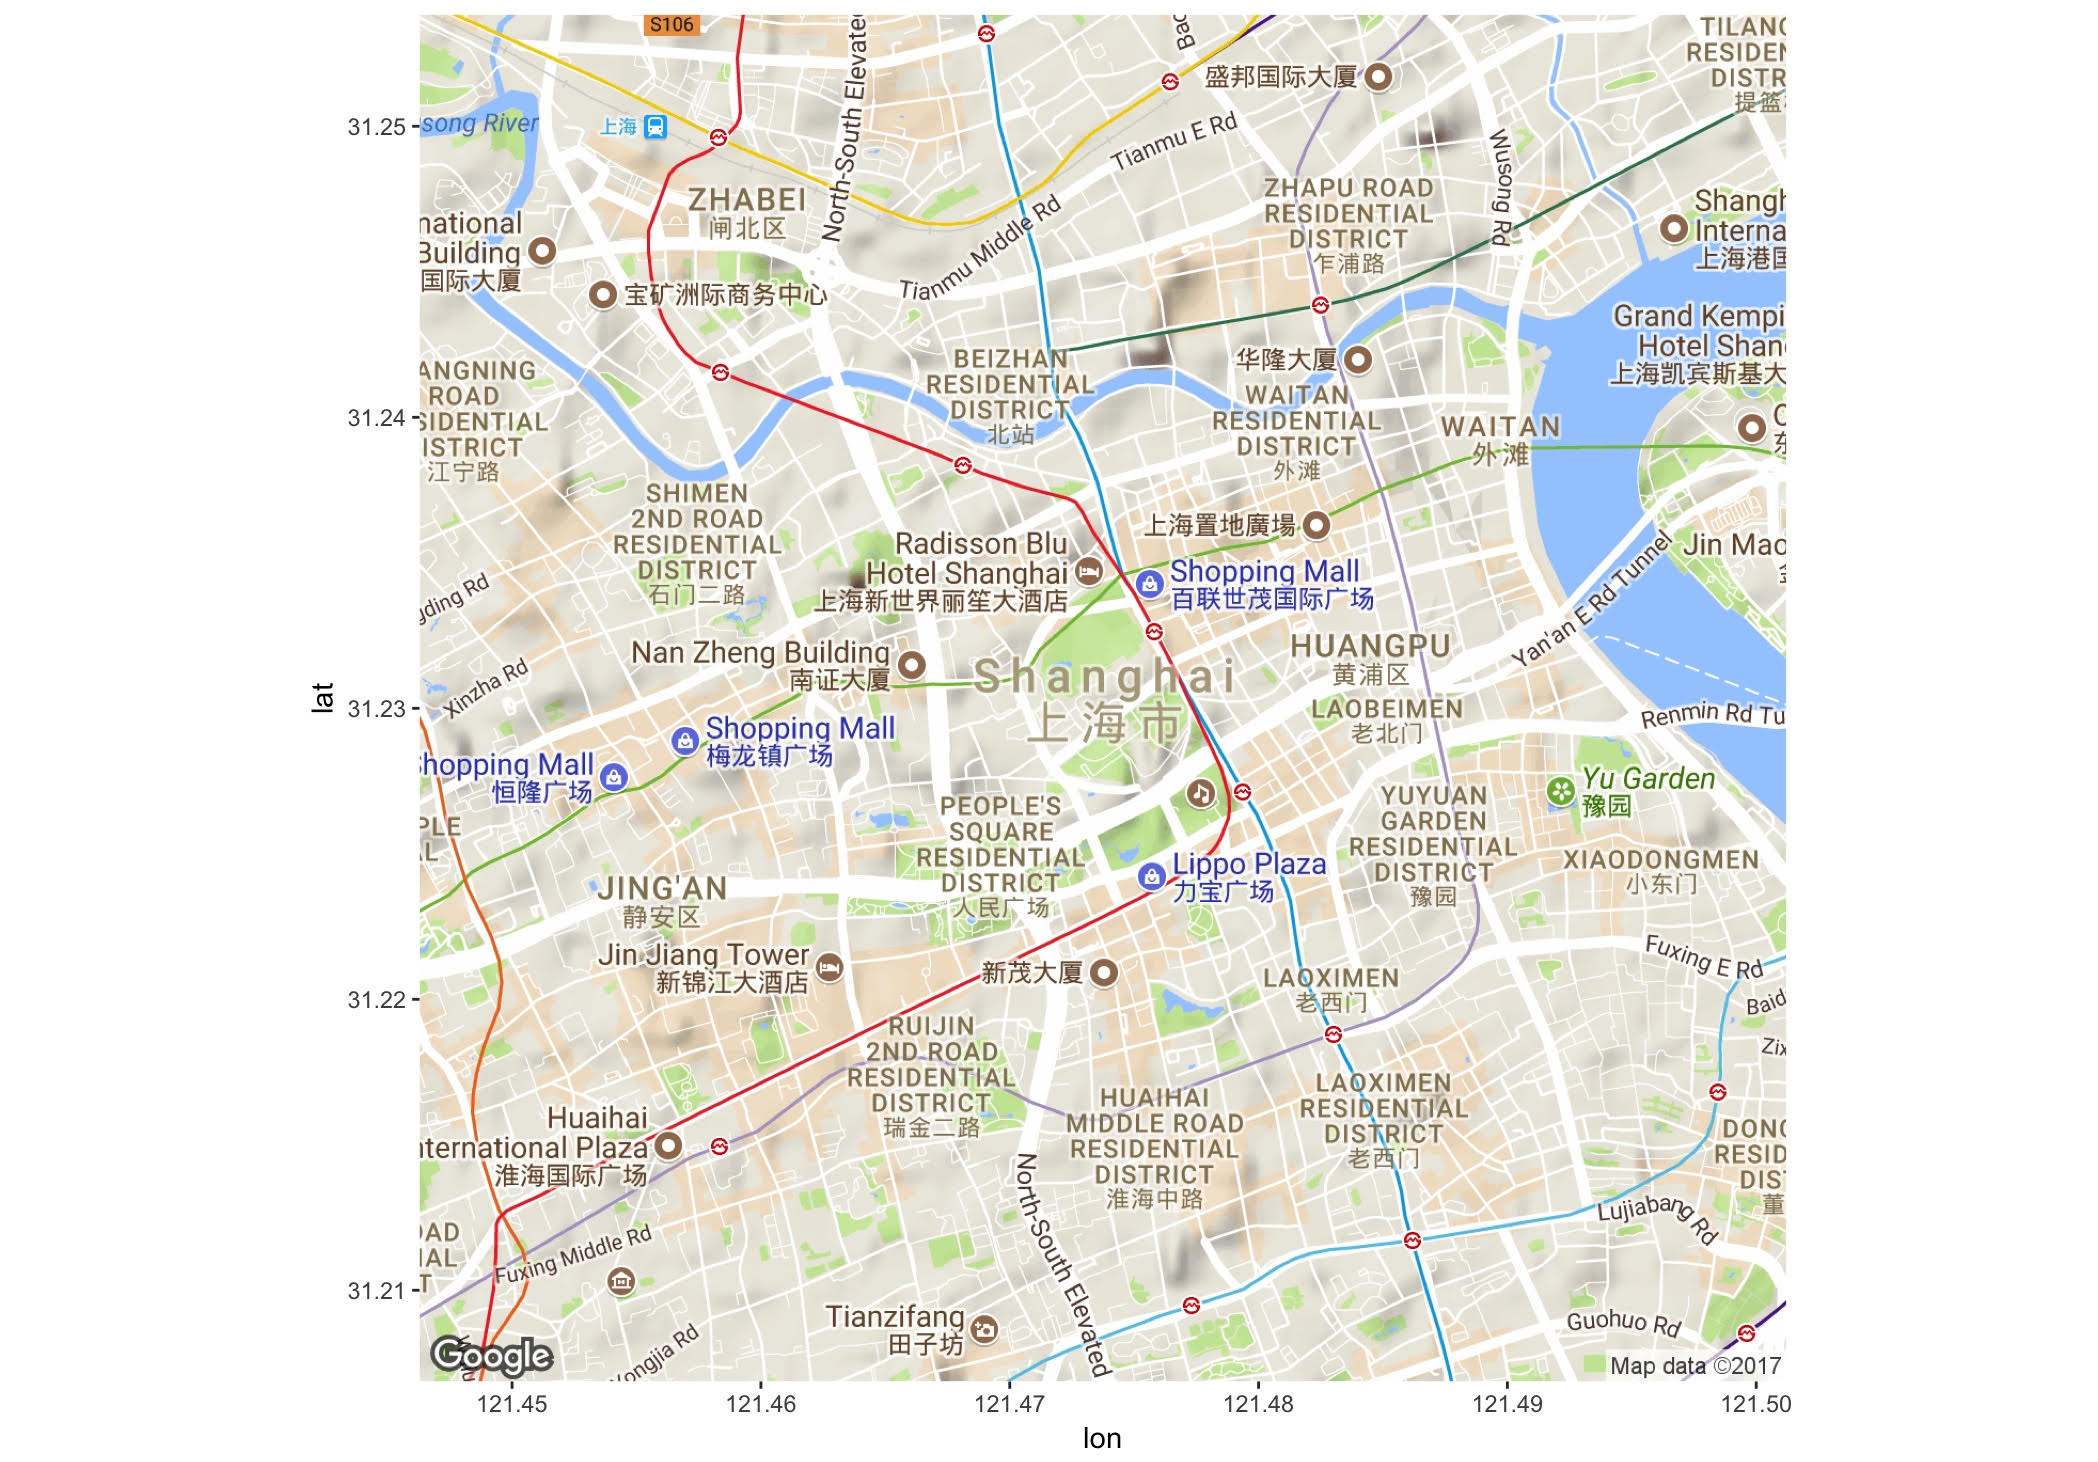
So we use Google Map to draw maps with big zoom levels.
Google Maps
The benifit of Google is we don’t need to specify coordinates manully. We can put country or city names as we search them in Google Maps.
1 | map <- get_map(location = 'Zhangjiang', zoom = 10) |
Others
With R and ggmap there are much more fancy feathres can be plotted in maps. For instance, points, polygons, choropleth map and also with external data.
References
[1] GitHub | A package for plotting maps in R with ggplot2
[2] Eric C. Anderson | Making Maps with R
[3] kimgilbert | Making Maps with R