Save SVG in JS
To save a SVG when it is rendered in the page, you can write this in the console:
1 | var svgData = $("#figureSvg")[0].outerHTML; |
To save a SVG when it is rendered in the page, you can write this in the console:
1 | var svgData = $("#figureSvg")[0].outerHTML; |
Commonly, line chart is used to show the temporal change of a variable. But, if the value has a large range, it could take a large space for the chart to show the whole change. Horizon chart dissolved the fluctuations in the line charts in several bands and overlap the bands to show the large range of the values in a relative narrow space. It benefit us to compare various variable in a short time.
To ensure the cyber security, JavaScript does not allow a webpage to load extra dataset from another website by default. If you add the resources by using an URL, the error massage Cross-Origin Request Blocked: The Same Origin Policy disallows reading the remote resource at http://cl.ly/2wr4. This can be fixed by moving the resource to the same domain or enabling CORS. will be shown on the console.
SRID is a spatial reference identifier. The SRID of WGS84 is 4326. In Postgis, the spatial query is based on the geometries have the same SRIDs. When using the PostGIS Shapefile Import/Export Manager, the SRID is shown.
It is not necessary to manually mark each change of the latex file. One can edit directly in the tex file, using latexdiff to mark the changes texts. One drawback is that when changing the titles of the figures and tables, the changes would note be properly marked.
To add a footnote in a figure caption:
1 | \begin{figure}[!ht] |
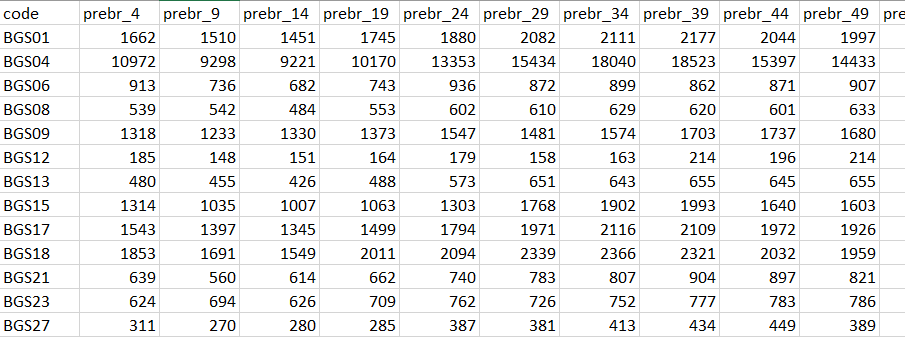
The test data is 2D data:
To convert two-dimensional table to one-dimensional table in JavaScript:
Geojson benefits the geo-data visualzing. Here we introduce two methods of loading external geojson to Leaflet.
GeoPandas provides extension to pandas. It makes geo-data processing and geo-visualization much easier. geojson can be parsed and visualized easily.