Using Geojson to Draw a Map
Why Leaflet
Leaflet is an open-source JavaScript library, which supply so many plugins we can use for map making.
Based on Leaflet, geojson is even more friendly to geo-data visualization. Tutorials are easy to follow.
Draw Points
Firstly, we include JavaScript packages:
1 | <script src='https://api.tiles.mapbox.com/mapbox-gl-js/v0.37.0/mapbox-gl.js'><span class="xml"></script> |
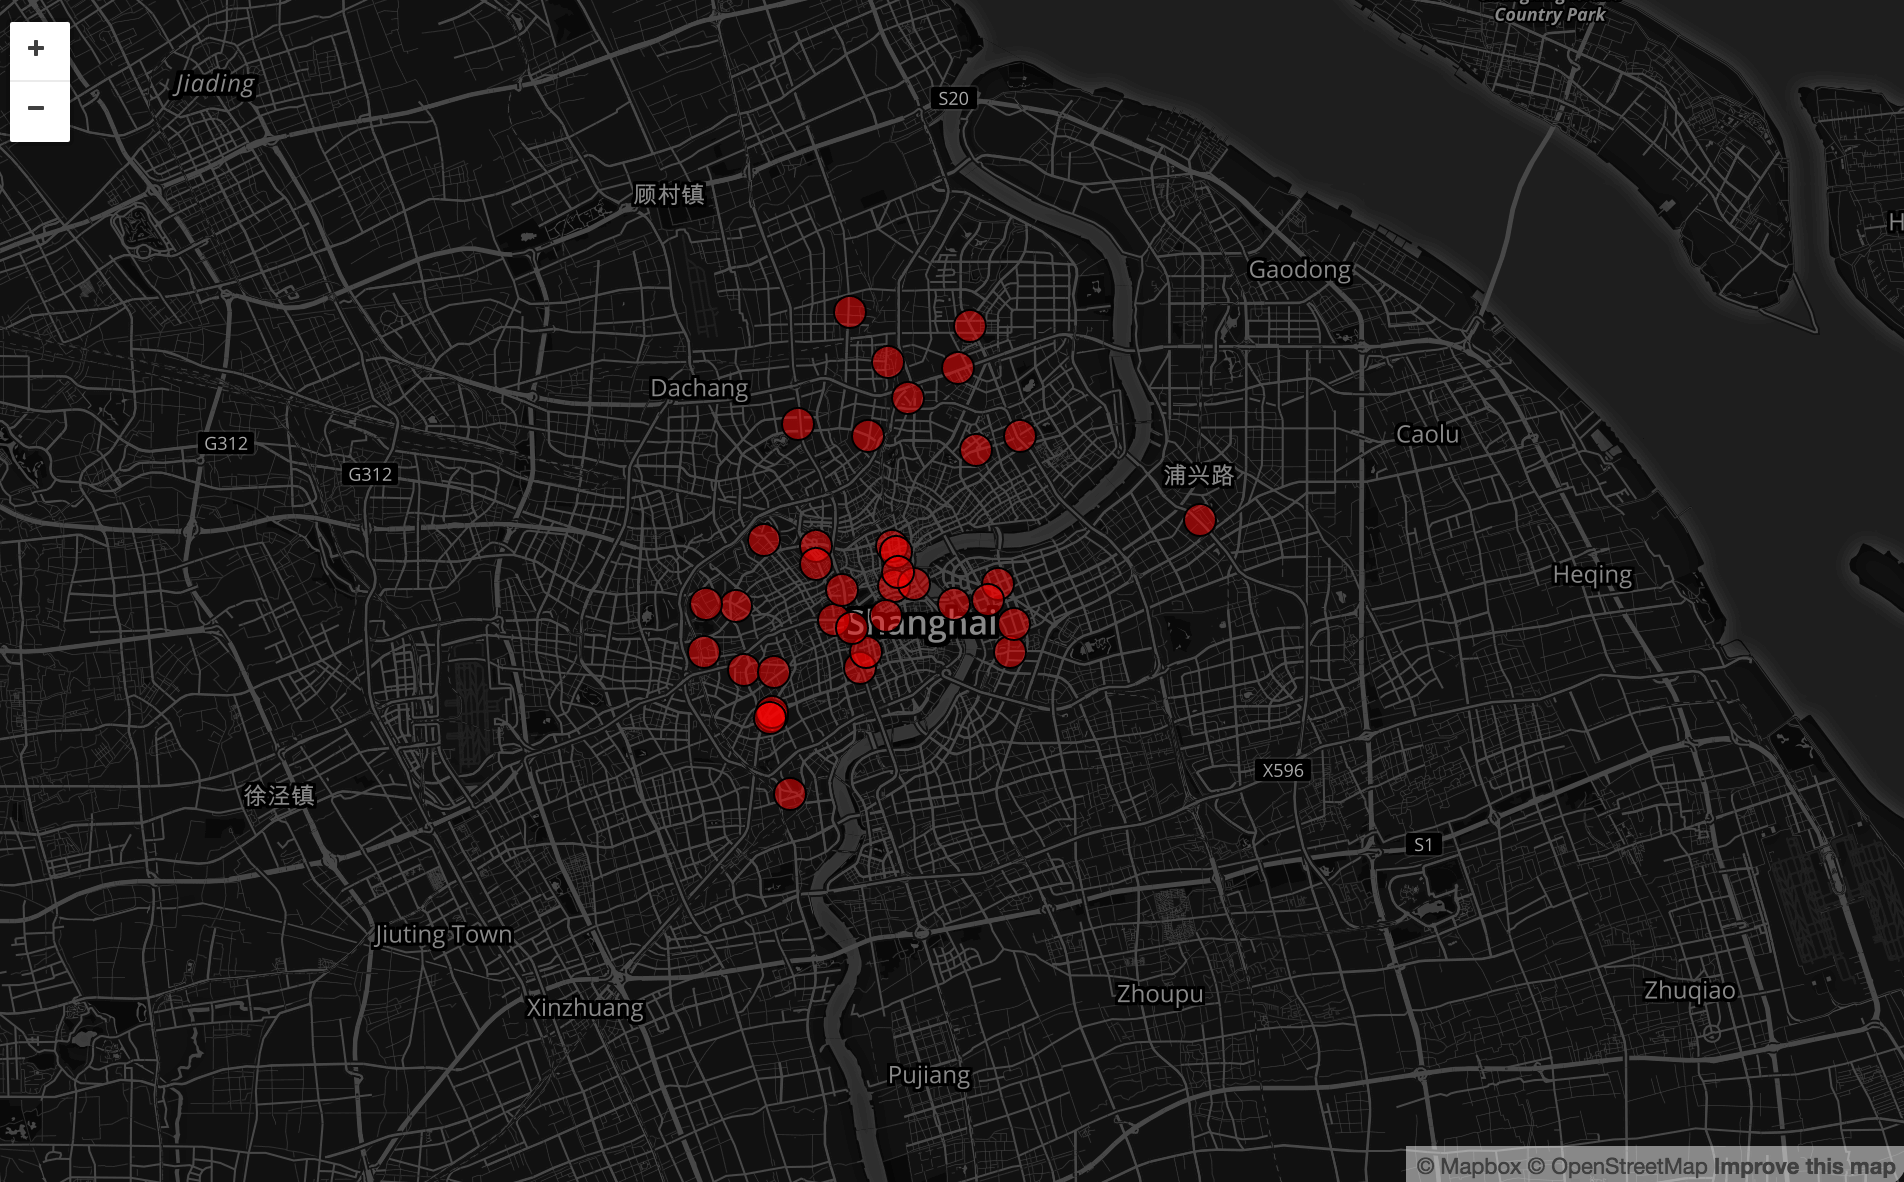
Then draw base map, we use Mapbox in this case:
1 | // using Leaflet API |
Setting for points’ propoties:
1 | var geojsonMarkerOptions = { |
Then load geojson file and parse it. L.geoJSON will parse our geojson file, create a geojson layer. pointToLayer is a function used for points visualizaiotn. The first augment feature is means features in geojson, the second augment latlng stands for location information included in geojson. If geojson file is nicely formatted, then location will be automatically parsed here. Default is to spawn a marker.
1 | $.getJSON("filepath.geojson",function(Data){ |
Reference
[1] Heatmap example using Open Data from San Juan County WA and Mapbox-GL.js
[2] Leaflet API Reference